Read your reports
Understand service volume, response times, resolutions and broadcasts.
Open Reports. The section has seven views: Now, Conversations, Replies, Resolutions, Team, Messages and Broadcasts. The period and channel you choose travel with the tab; a figure without those filters is no good for comparing.
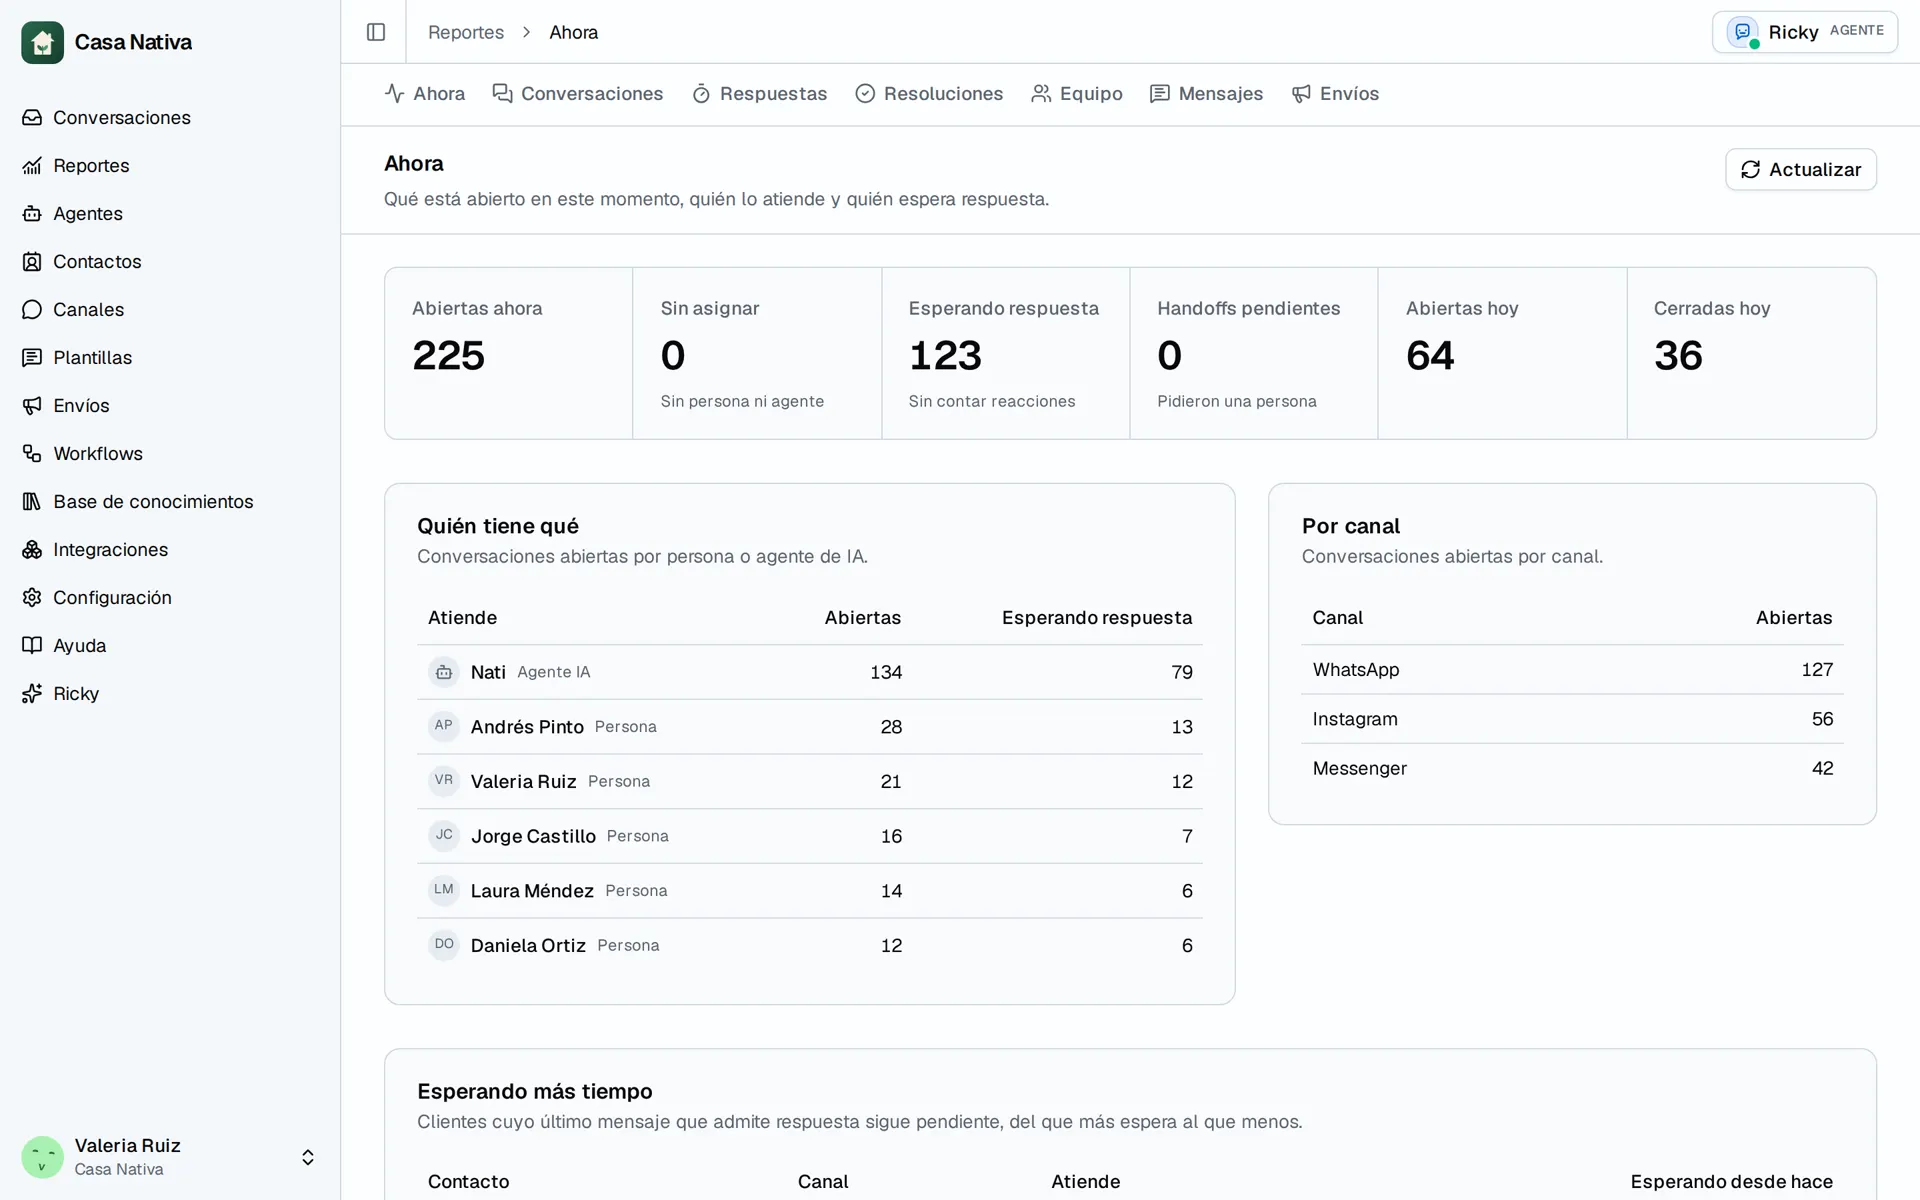
Demo organization: Casa Nativa. Interface shown in Spanish.
Now
This is the live view. It shows open conversations, how many are unassigned, the ones opened and closed today, and who has what. The Waiting longest table lists customers whose last message that allows a reply is still pending, from the longest wait to the shortest. Reactions don't open or resolve a wait.
Use it to split up today's work. Since it changes as messages arrive, treat the figure as a snapshot of the moment, not as the period's result.
Conversations
Shows openings and closings per day. An opening includes new conversations and ones reopened by a message after closing. The day-of-week by hour maps use Panama time; keep that in mind if your team works in another time zone.
Replies
Measures how long the customer waited to get a reply. A reply is the message that answers the customer: a person from Ricky or from the channel's app, or an AI agent. Automations, templates and reactions don't count.
Shows the average, median and p90. The average goes up with a few very late replies; the median describes the typical experience and the p90 the slow tail. When comparing people or channels, don't read only the average. The same view has the time per member, per channel and replies per conversation.
Resolutions
Measures the period's closings: how many conversations were closed, how long they stayed open (median and average) and how long they took to get their first assignment. Assignments per close counts owner changes before closing; a high number can point to handoffs or confusing triage.
Review the full distribution before concluding that hard cases get resolved fast: the median can hide the tail.
Team
Compares people and AI agents: assigned conversations, messages sent, closed conversations and times. The amount sent shows activity, not quality. Before evaluating someone, consider whether they handle long inquiries, several channels or cases they received from someone else.
Messages
This is the volume of messages received and sent, their types and their delivery. The activity-by-hour chart uses Panama time. The median time includes replies within a continuous four-hour window; it isn't a measure of every case with no time limit.
The delivery funnel uses the latest status reported by the provider and counts each message at its furthest stage: a read message also went through sent and delivered, but they aren't three different messages.
Broadcasts
Summarizes the period's broadcasts: broadcasts and recipients per day, the result per recipient and how many were read. A sent message doesn't confirm the customer received it; check the details before resending, so you don't duplicate the ones that did arrive.
Review routine
- Choose the period and the channel.
- Start with Now to handle what's waiting.
- In Conversations, spot peaks and compare the team's coverage.
- Review times together with resolutions; a low median doesn't explain cases with no reply.
- Check failed messages and broadcasts with problems.
- Adjust assignments, instructions or hours based on what you find.
If a figure looks wrong, note the tab, the period, the channel, the metric and a concrete example. Include those details when you ask for help.
To receive these results on a schedule, set up Email reports.